
The base M4 exposes enough information for macOS to report two CPU clusters, their L1 data caches, their shared L2 caches, and a 128-byte cache line. It does not expose a conventional L3 or System Level Cache capacity. A Rust microbenchmark can recover the CPU-visible cache boundaries, but it cannot turn an undocumented system cache into a trustworthy capacity number.
The experiment used one dependent randomized load per 128-byte line over working sets from 32 KiB to 128 MiB. Background quality of service kept the test on logical CPUs 0–5, while interactive quality of service kept it on CPUs 6–9. Those two passes reproduce the expected 64 KiB/4 MiB efficiency-cluster hierarchy and 128 KiB/16 MiB performance-cluster hierarchy.
The more interesting result is comparative. A simple midpoint marker places the broad E-cluster cache-to-memory transition near 6.8 MiB and the P-cluster transition near 26.7 MiB. The ratio is 3.93×, almost exactly the known 4× ratio between their shared L2 capacities. No second, common latency shoulder appears that can be assigned confidently to a separate SLC.
The cache macOS does not name
The investigation began with an apparently simple hardware question: how large is the base M4’s System Level Cache?
On a conventional desktop processor, a tool may report private L1 and L2 caches followed by a shared L3. Apple silicon does not present its SoC that way. The CPU clusters have ordinary cache levels, while the larger SoC also contains fabric, memory controllers, a GPU, media blocks, neural hardware, and system-level caching behavior that Apple does not describe through a public capacity register.
sysctl reports the cluster L1 and L2 capacities. Queries for a conventional hw.l3cachesize or per-cluster L3 produced no value on this machine. That absence is not evidence that no other on-chip cache exists. It only means the operating system does not expose one through that interface.
A userspace timing curve can reveal boundaries in the path taken by CPU loads. It cannot name every physical structure participating in that path.
What the machine reports
The measurements ran on a Mac16,12 with a base Apple M4 and ten logical CPUs.
| Property | Performance cluster | Efficiency cluster |
|---|---|---|
| Logical CPUs | 4 | 6 |
| L1 data cache | 128 KiB per core | 64 KiB per core |
| Shared cluster L2 | 16 MiB | 4 MiB |
| Cache-line size | 128 bytes | |
sysctl hw.model machdep.cpu.brand_string hw.ncpu \
  hw.perflevel0.name hw.perflevel0.logicalcpu \
  hw.perflevel0.l1dcachesize hw.perflevel0.l2cachesize \
  hw.perflevel1.name hw.perflevel1.logicalcpu \
  hw.perflevel1.l1dcachesize hw.perflevel1.l2cachesize \
  hw.cachelinesize
These values provide two known reference points. If the microbenchmark cannot recover the 4 MiB and 16 MiB L2 behavior, it should not be trusted to infer an undocumented cache farther down the hierarchy.
Why a dependent pointer chase
A streaming loop is excellent for measuring bandwidth, but poor for isolating load latency. Modern cores can prefetch sequential addresses, issue several independent misses, and overlap memory work. The result then describes throughput across many in-flight requests rather than the time required by one load.
The probe instead creates one randomized cycle containing every cache line in the working set. Each node stores the index of the next node. The next address is unknown until the current load completes:
#[inline(never)]
fn chase(storage: &[usize], mut index: usize, iterations: u64) -> usize {
    for _ in 0..iterations {
        index = unsafe { *storage.get_unchecked(index) };
    }
    std::hint::black_box(index)
}
One node is placed at the beginning of each 128-byte cache line. A Fisher-Yates shuffle driven by a small deterministic generator establishes the traversal order. This does three useful things:
- dependency prevents the core from issuing later loads before the current address is known;
- random order makes ordinary sequential prefetching ineffective;
- one complete cycle gives each cache line one visit before reuse.
The loop measures dependent-load latency, not cache bandwidth. Its absolute nanoseconds include the core’s clock state, QoS policy, translation overhead, interconnect, cache lookup, and memory service. Its strongest evidence is therefore the shape and location of repeatable transitions.
Separating E and P cores without affinity
macOS does not offer ordinary applications a portable “pin this thread to CPU 2” contract. It does provide quality-of-service classes. The benchmark uses pthread_set_qos_class_self_np with background QoS to favor the efficiency cluster and interactive QoS to favor the performance cluster.
QoS is a scheduler hint, not hard affinity, so the benchmark also calls pthread_cpu_number_np immediately before and after each timed trial. It records all observed logical CPU IDs and counts trials whose endpoint CPU changes.
| Pass | QoS | Observed CPU IDs | Interpretation |
|---|---|---|---|
| E-cluster sweep | Background | 0–5 only | Six efficiency CPUs |
| P-cluster sweep | Interactive | 6–9 only | Four performance CPUs |
Background trials migrated frequently among IDs 0–5, but did not cross into IDs 6–9. Discarding every migrated 100 ms window proved impractical and unnecessary for the shared E-cluster L2 question. The final result retains all nine trials, reports migration metadata, and uses the median. An endpoint check cannot detect a thread that migrates away and back within one trial, which remains a limitation.
The experiment
The working-set sweep starts at 32 KiB and ends at 128 MiB, with dense samples around the known 4 MiB and 16 MiB L2 capacities and the SLC hypothesis under test. Each size follows the same sequence:
- allocate the working set and build a deterministic randomized cycle;
- traverse the complete cycle repeatedly to fault in pages and warm the hierarchy;
- calibrate the iteration count against a target of approximately 100 ms;
- run nine timed trials;
- report median, minimum, maximum, iteration count, endpoint migrations, and CPU IDs.
The warm-up uses at least 100,000 dependent loads and otherwise four complete traversals. Timed iteration counts are clamped between 500,000 and 50 million, with at least four complete traversals for large working sets. The benchmark is compiled in release mode with thin link-time optimization and one code-generation unit.
The two latency curves
The chart uses a logarithmic working-set axis and separate vertical scales. Combining both clusters on one shared latency scale would flatten most of the P-core detail beneath the background-QoS E-core curve. Points are nine-trial medians; pale vertical whiskers show each size’s minimum-to-maximum range.
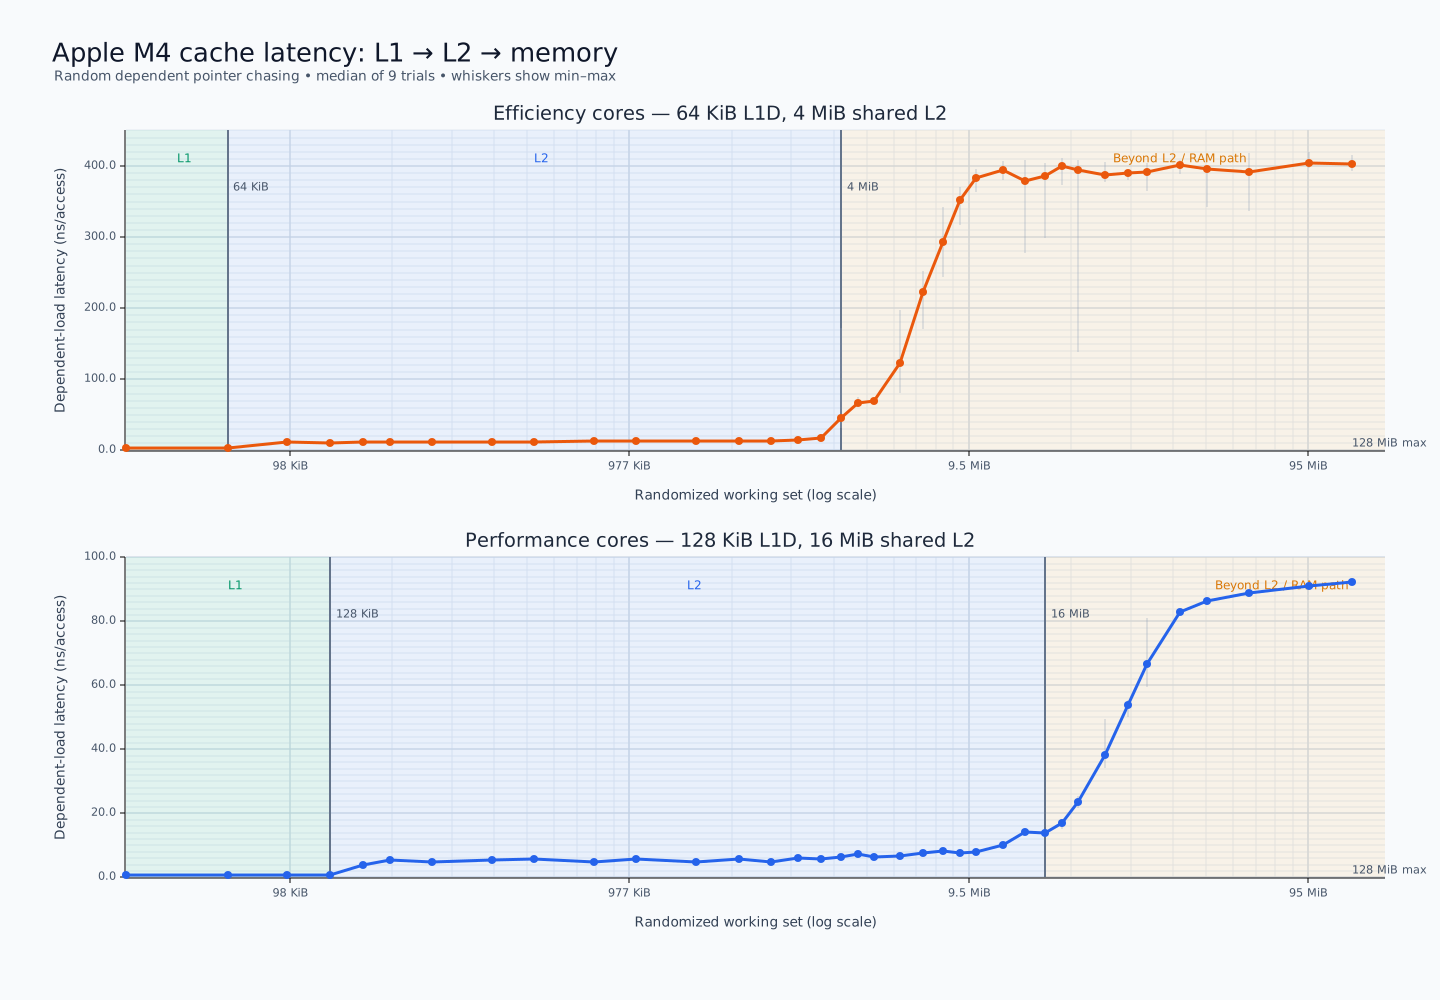
The two absolute scales should not be interpreted as a pure E-core-versus-P-core latency comparison. Background QoS lowers scheduling priority and can alter effective frequency, while interactive QoS favors the fast cluster. What survives that difference is the hierarchy: a flat L1 region, a larger L2 region, a broad rise after L2 capacity, and a high-latency plateau.
Efficiency cores: a sharp 64 KiB boundary and a 4 MiB knee
The E-cluster pass stays near 3.2–3.3 ns through 64 KiB, then jumps above 10 ns at 96 KiB. That is a clean signature of the reported 64 KiB L1 data cache.
From 96 KiB through roughly 2.5 MiB, medians remain mostly between 12 and 13.4 ns. The curve begins moving at 3 MiB, reaches 17.7 ns at 3.5 MiB, and rises to 46.2 ns at the nominal 4 MiB L2 boundary. By 10–12 MiB it has reached the approximately 390–400 ns background-QoS memory plateau.
| Working set | Median latency | Region |
|---|---|---|
| 32 KiB | 3.17 ns | L1 |
| 64 KiB | 3.30 ns | L1 limit |
| 96 KiB | 11.82 ns | L2 |
| 2 MiB | 13.20 ns | L2 |
| 3.5 MiB | 17.73 ns | L2 pressure begins |
| 4 MiB | 46.24 ns | Nominal shared-L2 capacity |
| 7 MiB | 223.50 ns | Mixed cache/memory transition |
| 12 MiB | 394.57 ns | Memory plateau |
| 128 MiB | 402.98 ns | Memory plateau |
The large absolute plateau should not be generalized as “M4 DRAM latency.” It is the latency observed by a background-QoS dependent chain on this machine. Its value includes the E core’s operating state and scheduler policy.
Performance cores: 128 KiB L1 and a much larger L2 envelope
The P-cluster pass stays at approximately 0.91 ns from 32 KiB through 128 KiB. At 160 KiB it rises to 3.88 ns, recovering the reported 128 KiB L1 data-cache boundary.
The broader L2 region stays mostly between 4.7 and 8.2 ns through 10 MiB. Latency reaches 10.3 ns at 12 MiB and roughly 14.1 ns at the nominal 16 MiB L2 boundary. It then climbs through 23.5 ns at 20 MiB, 53.8 ns at 28 MiB, and 82.9 ns at 40 MiB before approaching a 90–92 ns plateau.
| Working set | Median latency | Region |
|---|---|---|
| 32 KiB | 0.91 ns | L1 |
| 128 KiB | 0.91 ns | L1 limit |
| 160 KiB | 3.88 ns | L2 |
| 8 MiB | 8.16 ns | L2 |
| 16 MiB | 14.06 ns | Nominal shared-L2 capacity |
| 24 MiB | 38.14 ns | Mixed cache/memory transition |
| 40 MiB | 82.86 ns | Near memory plateau |
| 128 MiB | 92.26 ns | Memory plateau |
The curve is not a step at 16 MiB. A randomized cycle stresses sets unevenly and produces a distribution of eviction points. The transition begins before nominal capacity and takes more than one additional cache capacity to settle. This is why reading one visual knee as an exact byte count would be misleading.
The useful 3.93× comparison
A simple normalized marker makes the cluster comparison more informative without pretending to fit a detailed cache model. For each pass, take a representative L2 plateau, a representative memory plateau, and find the working set where the curve crosses their midpoint:
| Cluster | L2 plateau | Memory plateau | 50% transition |
|---|---|---|---|
| Efficiency | 13.33 ns | 393.96 ns | 6.80 MiB |
| Performance | 7.49 ns | 90.13 ns | 26.73 MiB |
The known cluster L2 capacities have a ratio of 16 MiB ÷ 4 MiB = 4×. The transition markers scale by 3.93×. This does not mean the effective cache capacities are literally 6.8 and 26.7 MiB; those points are influenced by the entire transition shape. Their ratio is useful because both curves were generated by the same access pattern.
The close scaling strongly suggests that the dominant broad transitions in both panels are the two cluster L2 caches giving way to the memory path. If a fixed additional shared cache were appearing as an ordinary inclusive next level in both passes, the transition relationship would be expected to depart from a nearly pure 4× L2 scaling or reveal another common shoulder.
Why this does not measure the SLC
The experiment was capable of finding a separate latency regime, but did not produce one that can be assigned uniquely to an SLC. That negative result has several possible explanations:
- CPU demand loads may not allocate in the system cache like an ordinary inclusive L3;
- the SLC may behave as a victim, non-inclusive, fabric, or agent-dependent cache;
- hashing, slices, replacement, or memory-controller behavior may blend SLC hits into a broad transition;
- the CPU-visible effective capacity may differ from physical SRAM capacity;
- other SoC clients and power policy may change residency while the benchmark runs.
Any of these can make a real physical cache invisible to this one-thread test. Conversely, assigning part of the 4–12 MiB E-core slope to an assumed SLC would be circular: the benchmark would be labeling the curve with the capacity it was supposed to discover.
A stronger physical-capacity result would need vendor documentation, die analysis, privileged or undocumented performance counters, or a carefully validated cross-agent coherence experiment. Even then, one would need to separate physical capacity from the portion usable by CPU demand loads.
Limits and repeatability
The benchmark is small enough to audit, but several limits should remain attached to its numbers.
- No strict core affinity: QoS produced clean cluster separation in these runs, but macOS remains free to move the thread within a cluster.
- Endpoint-only migration detection: sampling before and after a trial cannot detect a migration away and back.
- Frequency and QoS: nanoseconds include different operating policies. Capacity transitions are safer to compare than raw E/P latency ratios.
- One access pattern: randomized dependent loads intentionally suppress memory-level parallelism. Streaming, independent, writable, shared, and GPU-originated traffic may use the hierarchy differently.
- One machine and OS state: firmware, macOS, thermal state, background load, and M4 product variant can affect results.
- No hardware event attribution: elapsed time says that a load became slower, not which physical block serviced it.
Nine medians are adequate for mapping the large transitions seen here, but not for claiming cycle-perfect latency. Repeated passes after a cool-down, with idle monitoring software and recorded clocks or power state, would tighten absolute values.
Reproducing the sweep
The probe was built with Rust 1.97.1 and Plotters 0.3.7. Each full pass uses nine trials with a 100 ms target and scans to 128 MiB:
cargo build --release

./target/release/m4-cache-probe \
  --qos background \
  --trials 9 \
  --target-ms 100 \
  --max-mib 128 \
  --output results/m4-background.csv

./target/release/m4-cache-probe \
  --qos interactive \
  --trials 9 \
  --target-ms 100 \
  --max-mib 128 \
  --output results/m4-interactive.csv

cargo run --release --bin m4-cache-plot
The SVG renderer reads both CSVs, uses a logarithmic working-set axis, marks the capacities reported by macOS, and gives each cluster its own vertical scale. Publishing the CSVs matters because the chart necessarily compresses migration counts, trial ranges, and exact values.
What the experiment actually establishes
The Rust pointer chase passed its most important sanity check. Without being told where the measured curve should change, it recovered the 64 KiB and 128 KiB L1 boundaries and produced broad spill regions consistent with the 4 MiB and 16 MiB shared L2 caches reported by macOS.
The efficiency sweep remains around 13 ns while comfortably inside its L2 and approaches its background-QoS memory plateau by 10–12 MiB. The performance sweep remains under roughly 8.2 ns through 10 MiB, then climbs across the teens and twenties of MiB before reaching its plateau around 40–64 MiB. The normalized transition points scale by 3.93×, matching the 4× difference in cluster L2 capacities.
That agreement gives confidence in the benchmark and removes confidence from the hoped-for SLC answer. The visible transitions are already explained by the known CPU caches. There is no clean residual feature from which to infer a physical system-cache capacity.
The result is useful precisely because it stops where the evidence stops: the M4’s CPU cache hierarchy is measurable from userspace; its physical System Level Cache capacity is not established by this access pattern.
Sources
- Raw E-cluster/background-QoS CSV
- Raw P-cluster/interactive-QoS CSV
- Full-resolution Plotters SVG
- Rust documentation:
std::hint::black_box - Plotters Rust data-visualization library
- Apple libpthread header, including
pthread_cpu_number_np - Apple Newsroom: Apple introduces M4 chip

The primary evidence is the published raw measurement data from the tested Mac16,12. Cache capacities in the shaded chart are the values returned by macOS sysctl; the curves are measured independently. No physical SLC capacity is asserted.